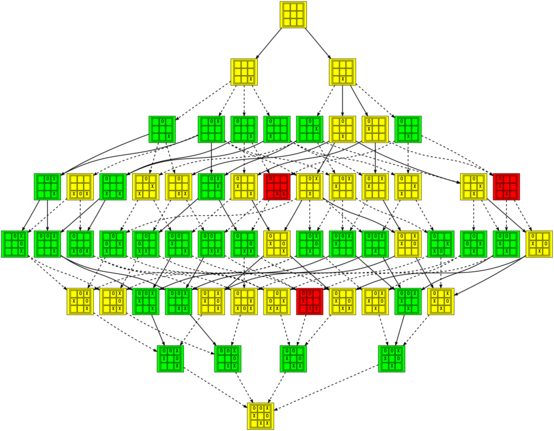
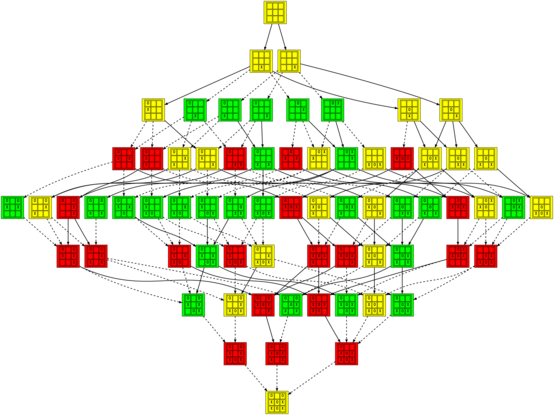
Just a few days ago a lucky train of thought arrived at the delightful realization that the game of Tic-tac-toe is just barely small enough to be graphed out in its entirety. Despite the fact that there are 19,683 different arrangements of X’s, O’s, and blanks on a 3×3 board, and 362,880 different orderings for the nine squares, if we eliminate symmetry and recognize when different sequences of moves lead to the same position, there are only 765 distinct board positions reachable through normal play. All we have to do is hook them up:
In that image and the others (which you should click on to see them at a reasonable size), positions are colored green when they are winning for the first player (X), red when they are winning for the second player (O), and yellow when they are tied. The transitions between positions are solid for good moves and dashed for bad moves.
The graph of the complete game of Tic-tac-toe is a bit much to take in all at once, but there are some interesting subgraphs as well. For example, this is the graph of all perfect games (where neither player makes a mistake):
It doesn’t go without saying that all of the positions in that graph are tied (so I omitted the coloring).
On the other hand, this is the graph of all games where almost every move is a mistake (all but the first and the last, which can never be):
One of the more interesting things I noticed when playing with these data structures is that there are certain positions which are tied, but cannot be reached without making mistakes. For example here are graphs showing two tied positions that can only be reached by the first or second player making a mistake, respectively:


Comments